|
L. RAVÀ
Department of
Mathematics, University of Rome “Tor Vergata”, Italy
M. G. CALVANI
Department of Mathematics, University of Rome “Tor Vergata”, Italy
S. HEISTERKAMP
Department of Clinical Epidemiology and Biostatistics, University of Amsterdam,
the Netherlands
L. WIESSING
European Monitoring Centre for Drugs and Drug Addiction, Lisbon, Portugal
C. ROSSI
Department of Mathematics, University of Rome “Tor Vergata”, Italy
Abstract
Introduction
Epidemics of problematic drug use
Estimating the incidence of problematic drug use: the Back Calculation approach
A case study: the heroin epidemic in Italy
Estimating the hidden onset incidence from observed therapy incidence
References
ABSTRACT
Modelling the incidence of first opiate use can be a useful tool for understanding the process of diffusion of drug use in space and time. Such information is important in evaluating current and future needs for and effects of services and interventions.
Back calculation can be used in the analysis of spatial and time trends of incidence of drug users who will eventually seek treatment. This is done using incidence data of drug users entering first treatment and an external estimate of the latency period distribution, that is, the time lapse between first use and first treatment. The authors of the present article studied the heroin epidemic in Italy using Empirical Bayesian Back Calculation, at the national level and for eight regions of the country, using data from public treatment services for the period 1986-1998, which are routinely collected by the Ministry of Health. After a period of rapid increase during the 1980s, the nationwide aggregated incidence curve seemed to stabilize at the beginning of the 1990s. While that trend might possibly indicate some success in prevention efforts, it could well be due to the fact that the natio nal epidemic is the combination of several local epidemics that emerge, saturate and move geographically. That hypothesis is confirmed by the regional analysis, which provides a picture of several sub-epidemics showing peaks of different size, location and time. In particular, Liguria, Piedmont and Emilia Romagna peaked more or less simultaneously before the other regions, followed by Tuscany, Latium and Sardinia (which show the highest incidence per million inhabitants), while Trentino and Friuli never peaked.
The results of the Empirical Bayesian Back Calculation form an important evidence base for planning, monitoring and evaluating preventive interventions and for forecasting treatment needs in the near future, at both the regional and the national level.
The implementation of drug policy needs to be evaluated in order to set up more efficient strategies to control drug-related phenomena and to forecast future service needs.
To evaluate interventions aimed at prevention and care for drug users, suitable indicators are necessary. In particular, epidemiological indicators may provide some evidence of the effectiveness of interventions directed towards drug users (control intervention) or the population at risk (prevention intervention). The possible prevention and care effectiveness indicators comprise statistics based on prevalence and incidence of drug users and prevalence and incidence of drug users being assisted by the health-care services. This may include statistics based on different critical periods in a drug user's career, such as the latency period from first heroin use to first treatment [1, 2] or the inter-relapse period [3].
However, since drug abuse is generally a stigmatized and hidden behaviour and is prosecuted in most countries, there have been varying degrees of under-reporting when standard epidemiological survey techniques (such as the National Household Survey on Drug Abuse in the United States of America) have been used. It is thus necessary to develop methods that allow a more accurate estimation of the extent of the phenomenon from observational secondary data on drug abuse that are available in various forms. Estimation techniques refer for the most part to models and methodologies to calculate the extent and dynamics of drug abuse in a community and/or at the regional or national level based on various observed phenomena (secondary data) and on information received from certain target populations [4, 5]. Secondary data can be defined as existing statistical and documentary information that is routinely collected and readily available, such as treatment figures, drug seizures, infectious disease indicators or numbers of drug-related deaths.
There are similarities between the spread of drug use, in particular for addictive drugs such as heroin, and the spread of infectious diseases. Use of drugs is communicated, obviously not as an organic agent, but as a kind of “innovative” social practice or custom, and not to everyone but only to those who, for whatever reason, are not immune (susceptible individuals). Once the basically contagious nature of drug use is accepted, it becomes possible to study and to model the process of transmission [3, 6, 7]. The epidemiological concepts of incidence (the rate of new cases occurring within a certain time period) and prevalence (the number of all existing cases at a certain moment in time) are thus operationally valuable in studying illegal drug use. Unfortunately, as already mentioned, the population of users cannot be properly studied by standard statistical (descriptive) methods, since such users, because of drug laws and policies currently in force in various countries, are engaged in illegal acts. They therefore resist identification and constitute a “hidden” population. As a result it is necessary to use inferential methods and mathematical models in studying problematic drug use. Using indirect indicators such as numbers going for therapy, such models make it possible to estimate interesting quantities such as prevalence and incidence. Epidemiologists have suggested first use of drugs, first continuous use and first addiction as incidence indicators. Of these, the incidence of first use is the best measure of spread, even if there are ambiguities and difficulties in determining it, since not all cases are known and the definition of a “case” is itself problematic, possibly ranging from occasional use to addictive daily use [8]. Nevertheless, incidence of first use retains special significance as the most suitable measure of the tendency of new individuals to become involved with addictive drugs. Incidence analysis can thus be used as a tool for examining the process of diffusion of drug use. In particular, incidence figures may provide an indication of whether the number of problematic drug users is growing (epidemic phase), falling or stable (endemic phase).
The authors' main objective is to establish an appropriate model in order to develop an estimation method to study the behaviour of such epidemiological indicators. The extended application of the method reported below has revealed its major characteristics and usefulness in relation to policy issues.
Recently developed techniques of examining the epidemiology of infectious diseases that utilize surveillance data to estimate incidence and prevalence are now available and can be adapted in order to obtain more accurate results and estimates. Certain Back Calculation methods developed seem particularly useful.
Back Calculation has evolved considerably in relation to work on acquired immunodeficiency syndrome (AIDS) projections. Briefly, knowledge of the numbers infected with the human immunodeficiency virus (HIV) and the incubation period distribution are used to predict the number of AIDS cases that are ex pected in the future (direct or forecast use); on the other hand, if the number of AIDS cases is known and information on the incubation period distribution is available, estimates for those previously infected with HIV can be obtained (indirect or inferential use). Since the proportion of those infected who will eventually develop AIDS is unknown and as the Back Calculation is based on numbers of diagnosed AIDS cases, the method provides estimates only for those infected who will eventually develop the disease. That number, however, is what health authorities need to base their financial planning on. The present article shows how the same method can be utilized to back calculate historical trends in incidence of problematic drug use, more specifically in incidence of first use, from first reports of drug users in treatment. Based on treatment data, the study described here provides accurate estimates of the incidence of drug users who will eventually enter treatment. This is clearly a highly selected sub-population, since it excludes those individuals who will stop using drugs or die before starting any treatment, or those who will never develop problems requiring treatment. However, the estimated incidence, which is an estimate of the number of those who will require treatment in the near future (the median lapse of time between the start of drug use and the first treatment has been estimated at five to six years), is appropriate for analysing spatial and time trends of problematic drug use, for planning, monitoring and evaluating preventive interventions and for forecasting treatment needs.
Back Calculation is a general type of deconvolution method originally proposed as a tool for estimating the minimum number of HIV-infected people and making short-term projections of AIDS incidence [9]. The basic idea of Back Calculation is to use a compilation of AIDS incidence data, an estimate of the incubation period distribution, usually externally obtained from a target population, in order to gain information about past HIV infection rates, which are usually unknown.
It is possible to use the same approach to back calculate, from observed data on drug users going for treatment, the incidence of onset of problematic drug use (same as for HIV infection) for those who will eventually be observed. If, for example, information is available about users first attending treatment (observed incidence), and if the actual incubation period or latency period distribution, that is, the time lapse between first use and first treatment are known or can be estimated, then it is possible to back calculate the incidence of first use on the basis of the known numbers of observed drug users. In other words, the Back Calculation makes it possible to estimate the incidence of drug users eventually seeking treatment using data on the incidence of drug users in treatment and an estimate of the latency period distribution, obtained externally from a suitable sample (target population).
This method has been applied in the study of the HIV/AIDS epidemic using various explicit formulations, corresponding to specific assumptions as to the expected incidence of AIDS, the shape of the HIV infection curve, the incubation period distribution and the estimation procedure. Each different combination of the above assumptions results in a different method of Back Calculation.
Heisterkamp and others [10, 11] proposed a Back Calculation method based on an Empirical Bayesian approach that had recently been adapted for estimating the incidence of first use of drugs on the basis of therapy incidence data [12, 13].
The therapy incidence data and the data needed to estimate the latency period distribution should be provided by the health-care services offering treatment (of any kind) to drug users. In particular, the present version of Empirical Bayesian Back Calculation uses aggregated biannual incidence data of “new” individuals under treatment in health-care services (at their first treatment). These are classified according to date of first registration with the health-care service and any other variable that could be used as a covariate or stratification variable, such as gender, age, geographical area, educational level and type of health-care service.
Similar individual (non-aggregated) data can be used to obtain an estimate of the latency period distribution. This is not only needed for applying Empirical Bayesian Back Calculation, but it is also a simple tool to monitor the attractiveness of health-care services and harm-reduction programmes [1,2].
During the 1980s and 1990s, heroin by injecting caused the majority of interventions by both the health and the criminal justice departments in Italy [14-16]. The number of people in Italy between the ages of 15 and 54 who have used heroin at some time in their life is estimated to be not less than 300,000 [17, 18]. A description of the heroin epidemic based on official statistics follows, with the Empirical Bayesian Back Calculation method being applied in order to estimate the onset incidence curve of heroin use.
The estimated number of
heroin users is almost double the number of people in treatment within the
public services (based on returns from 518 public treatment services, representing
95 per cent of those services nationally and 100 per cent of their clients).
The majority of treatment requests (about 90 per cent, on average, in the
last 10 years) relate to heroin as the primary drug abused, since the beginning
of public service activities (mid-1980s). Figures I-VII report the time trends
of some interesting observable indirect indicators of problematic drug use
over the last decade [16].
Figure I. Requests for treatment in Italy, 1990-1998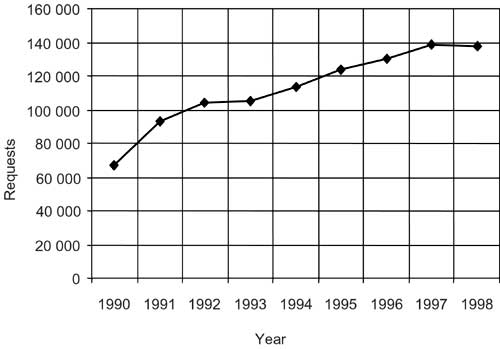 |
Figure II. All treatments in Italy, by age group, 1994-1998 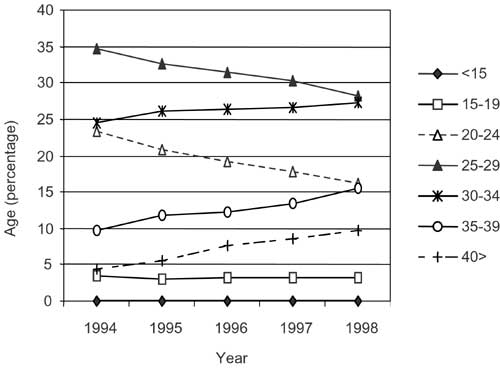 |
Figure III. First treatments in Italy, by age group, 1994-1998 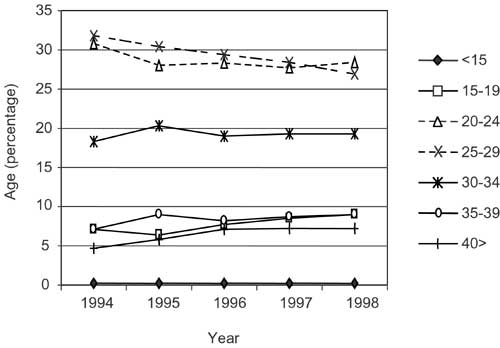 |
Figure IV. All requests for treatment in Italy, by age group, 1990-1998 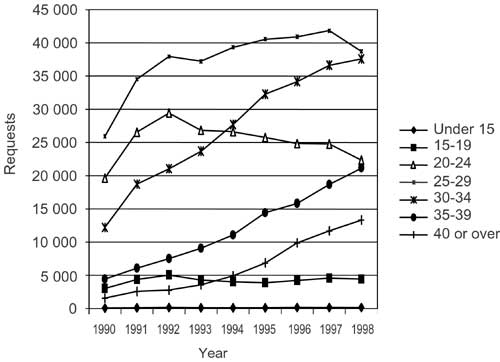 |
Figure V. First request for treatment in Italy, by age group, 1990-1998  |
Figure VI. Males referred for unlawful possession of drugs in Italy, by age group, 1997 and 1998 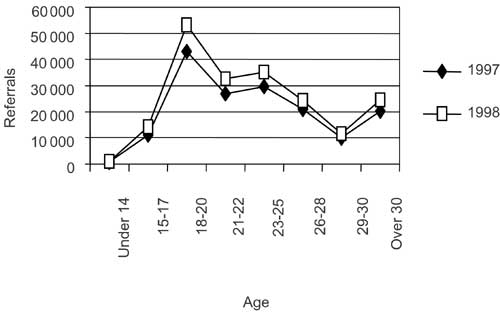 |
Figure VII. Females referred for unlawful possession of drugs in Italy, by age group, 1997 and 1998 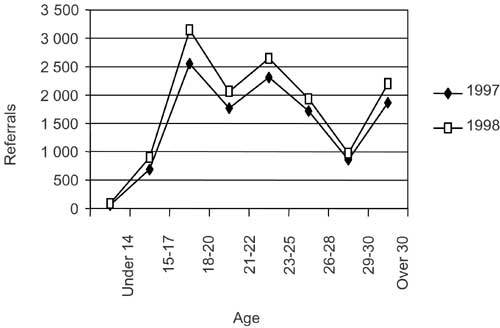 |
In terms of age of those in treatment, the trend is broadly towards an ageing population of drug users, as shown in figures I-VII (see also figures VIII-XIII. This may be due to a stabilizing or decreasing trend of the onset incidence of heroin use in the last decade at the national level. This hypothesis is contradicted in part by the data from the Ministry of the Interior related to people referred for unlawful possession of drugs (any), reported below, even though the young age of people involved in these latter events may also be explained by the fact that most of them relate to possession of cannabis.
Figure VIII. Drug users in treatment in Italy, by
region, with heroin as the drug of primary use, 1991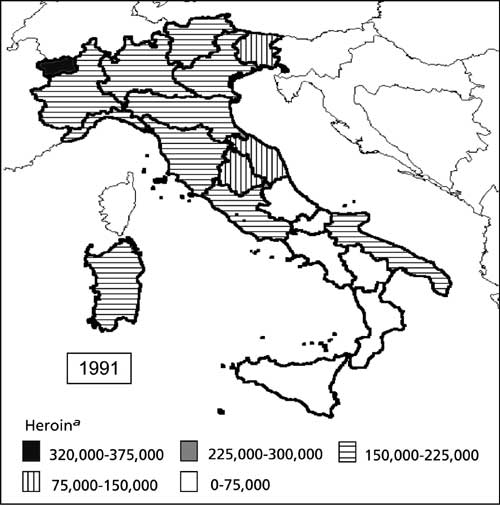 a The values give the number of treatments per 100 million residents (e.g. 100,000 means 0.1 per cent) |
Figure IX. Drug users in treatment in Italy, by region, with heroin as the drug of primary use, 1992 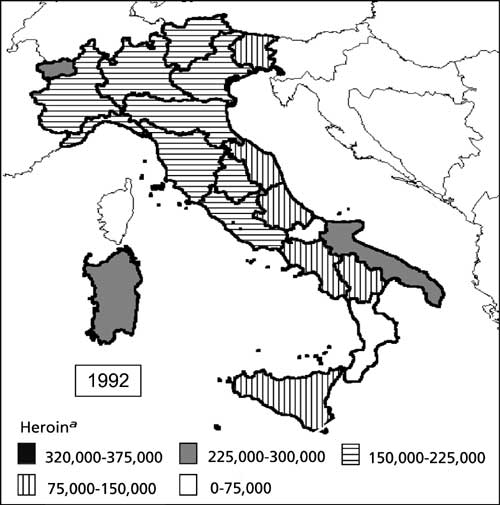 a The values give the number of treatments per 100 million residents (e.g. 100,000 means 0.1 per cent) |
Figure X. Drug users in treatment in Italy, by region, with heroin as the drug of primary use, 1993 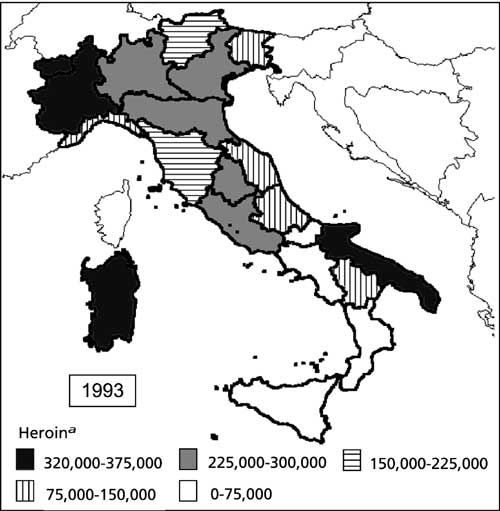 a The values give the number of treatments per 100 million residents (e.g. 100,000 means 0.1 per cent) |
Figure XI. Drug users in treatment in Italy, by region, with heroin as the drug of primary use, 1994 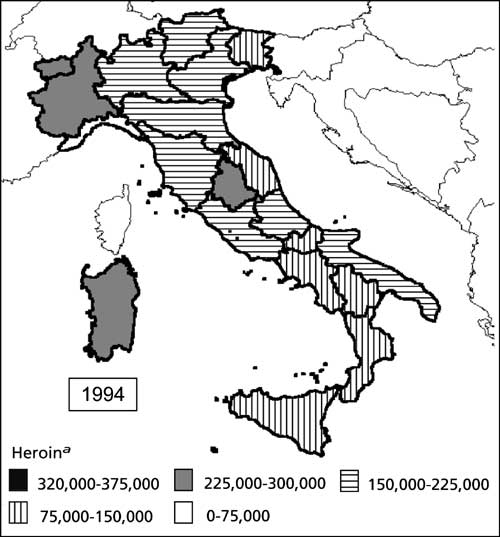 a The values give the number of treatments per 100 million residents (e.g. 100,000 means 0.1 per cent) |
Figure XII. Drug users in treatment in Italy, by region, with heroin as the drug of primary use, 1995 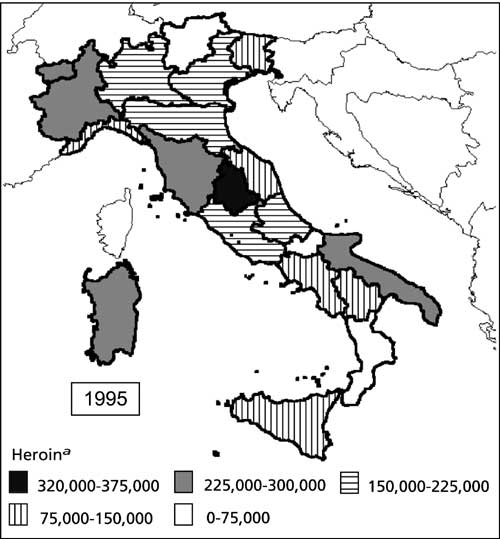 a The values give the number of treatments per 100 million residents (e.g. 100,000 means 0.1 per cent) |
Figure XIII. Drug users in treatment in Italy, by region, with heroin as the drug of primary use, 1996 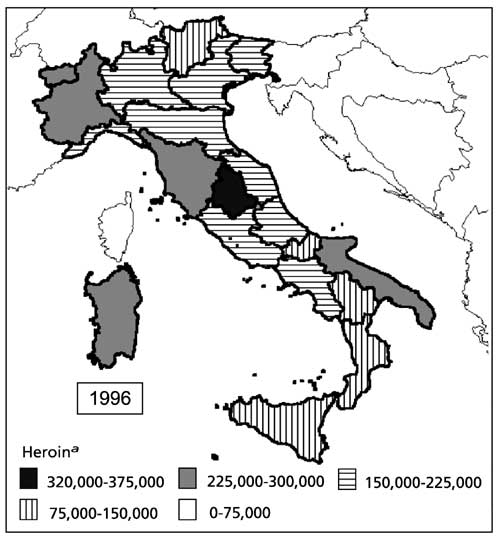 a The values give the number of treatments per 100 million residents (e.g. 100,000 means 0.1 per cent) |
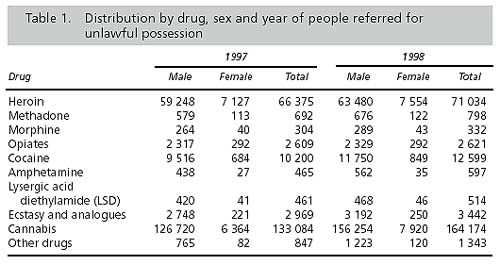
In terms of drugs possessed unlawfully, cannabis was by far the most common,
representing 61 per cent of all possession in 1997 and 64 per cent in 1998.
A considerable way behind came heroin, followed by cocaine, Ecstasy and other
opiates. Between 1997 and 1998, there was an increase in unlawful possession
of all controlled drugs. The most significant rises were for possession of
cannabis, cocaine, amphetamines and other drugs (primarily benzodiazepines).
There were also important but smaller increases in possession of methadone
and Ecstasy. Table 1 shows the distribution by drug, sex and year of people
referred for unlawful possession. It should be noted that table 1 refers
to the drugs that a person possessed and is therefore a greater number than
the number of persons found in unlawful possession.
More than 50 per cent of heroin users in treatment are concentrated in six regions, which, in general, are the most heavily populated (see table 2). However, there are variations between regions related to the relative impact both of problematic drug use in general and of heroin use in particular (figures VIII-XIII). The pattern of primary drug use is broadly consistent throughout the country, with heroin the dominant drug of misuse among drug users in treatment. Variations between regions can also be observed regarding this aspect (table 2). It is not clear why these differences exist between regions. They may reflect relative availability of drugs in different regions, law enforcement activities, treatment policy and practice or different attitudes towards drug use in the regions, as well as differences in the socio-economic situations. It is also possible that the dynamics of the heroin epidemic in the different regions reflect different behaviours resulting from the pressure of the black market and to the influence of the trafficking routes. The estimation of the onset incidence, by means of the Back Calculation method described above, both at the national and at the regional level, provides a better understanding of those differences and of the data, as shown below. In particular, a higher incidence of treatments with respect to the resident population is to be expected in regions with an older epidemic (table 2, fifth column). In other words, possible peaks in the estimated incidence curves are anticipated in those regions with higher rates of new treatments per 1,000 residents (table 2, fifth column).

Empirical Bayesian Back Calculation was first applied to national data provided for the period 1986-1998 by the Ministry of Health, which routinely collects data on clients in public and private services. Data on clients in private services were excluded as those clients are mostly referred from public centres and double counts would have been high. Data include only clients who checked in for treatment for the first time and do not include those who only contacted services but did not receive treatment (see figures I-VII). Treatment refers to any therapeutic and rehabilitation procedure, whether pharmacological or not, offered by the service, even outside the premises (prisons, therapeutic communities or hospitals). Public treatment centres are thought to provide about 50 per cent methadone-substitution treatments and 50 per cent psychiatric and social interventions, with high interregional variability [19].
The data
were classified according to age group, gender and region. The latency period
was estimated using various local data sets provided by the different regional
health authorities containing individual data on drug users in treatment.
From the results obtained, the period appears to be remarkably similarly
distributed over the different sites, with a median of between five and
six years and an average of between five and seven years. Figure XIV reports
the survival curves, estimated by the Kaplan-Meyer method [1, 12], only for
the data related to the five provinces of the Latium region. That time lapse,
however, appears to be much longer than in young drug users, suggesting that
age at first use is an important covariate to be included in any model [2,
14]. For each data set, the best parametric estimate of the latency period
distribution was obtained by using the P-P plot method (quantile best fitting),
which is available in the Statistical Package for the Social Sciences (SPSS)
used for the present application. The best model resulted, for each site
considered, in either a Gamma or a Weibull density (figures XVI and XVII)
with slightly different parameters [12]. On the basis of a sensitivity analysis
[13], based also on further secondary data, the most representative estimates
at the national level were achieved in a Gamma density, with parameters 1.51
(shape) and 0.30 (scale), and a Weibull density, with parameter 1.28 (shape)
and 5.33 (scale) (figure XV). The Gamma, being less dispersed than the Weibull,
is always associated with smoother incidence curves resulting from the estimation
procedure based on Empirical Bayesian Back Calculation. Further results and
discussion of the latency period analysis are reported elsewhere [2].
Figure XIV. The latency period: Kaplan-Meyer survival
functions |
Figure XV. The latency period: Gamma and Weibull distributions  |
Figure XVI. Gamma P-P plot of the latency period 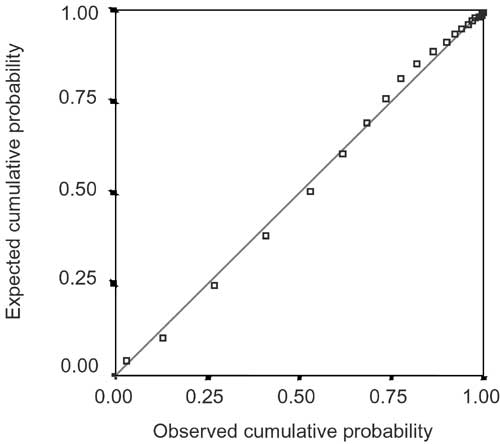 |
Figure XVII. Weibull P-P plot of the latency period  |
In order to apply Empirical Bayesian Back Calculation,
the original therapy incidence data were first multiplied by 0.70 to take
into account the estimated proportion of double counting and the proportion
of drug users in treatment who are not heroin users (about 10 per cent).
The results of the estimation are shown in figures XVIII and XIX. Figure XVIII reports the incidence curve of drug users estimated by Gamma and the Weibull latency period distribution, with and without age at first treatment as a covariate. Figure XIX reports the incidence curve of drug users under treatment estimated by Gamma and Weibull latency period distribution, with and without age at first treatment as a covariate; the observed therapy incidence data are represented by dots.
Figure XVIII. Incidence of drug users in the total population of Italy, estimated by Gamma and Weibull latency period distribution, with and without age at first treatment as a covariate, 1975-1998 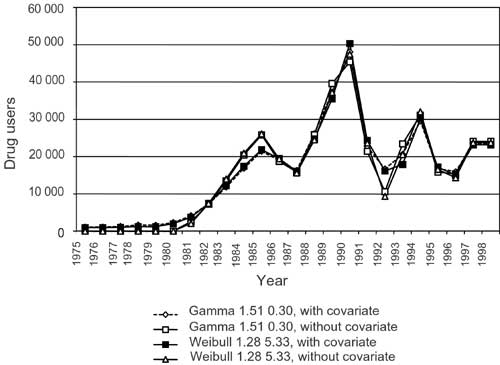 |
Figure XIX. Incidence of drug users in treatment in Italy, estimated by Gamma and Weibull latency period distribution, with and without age at first treatment as a covariate, total population, 1988-2006 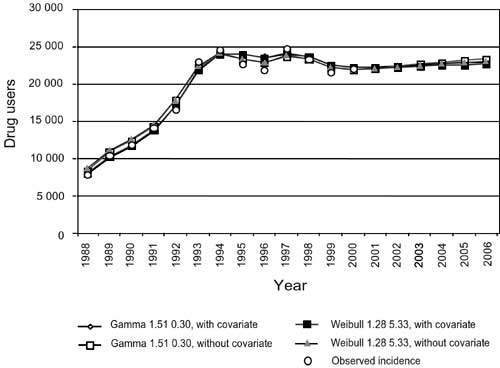 |
The incidence curves provided by the Empirical Bayesian
Back Calculation estimation procedure are dependent on the latency period
model chosen, but the location of the peaks of the epidemic seems to be a
reliable parameter. The qualitative trends also seem to be reliably estimated,
as shown below.
From information about heroin prevalence among males aged 18 provided by the annual surveys of military conscripts, information about distribution of age at the start of heroin use and overall prevalence estimates for recent years [20], it is possible to predict that the incidence curve will not show high oscillations. Figure XVIII indicates that, when the model is applied without the age covariate, the estimated curves show a higher oscillation than when the covariate is included. This suggests that the age covariate should always be included in the model, confirming the fact that age is a factor that strongly influences the latency period [2, 14]. Moreover, though the Gamma and Weibull distributions result in similar incidence curves, the Gamma curve is slightly smoother than the Weibull, as expected. Thus, the model based on the Gamma distribution with the age covariate included seems to provide the best representation of the epidemic. The incidence curve shows two peaks, the lowest peak in 1985 and the highest one in 1991. Nevertheless, this is not necessarily evidence of the existence of two different epidemics, since the two peaks could be determined by the combination of different local sub-epidemics developing differently over time.
The same trend, in particular the location of the peaks, can also be observed for the incidence curve estimated for males and females separately [19]. Nevertheless, the general trends for the two sexes are quite different: in particular, the second peak is higher for males and the first lower for females. This is in agreement with the observed trend in the male/female ratio in the therapy data available. The estimated overall size of the epidemic among the population under study, measured by the cumulative incidence from 1975 to 1998, is about 385,000. It is important to stress that, as mentioned above, that number underestimates the total size of the epidemic during that period, owing to the hidden population of drug users who will never request therapy. The number is in agreement with the perception of the phenomenon found in other sources and studies reporting prevalences in various years [18-20].
It must be stressed again that it is important to improve the information given by the Back Calculation estimate of recent incidence using all the external data available from different sources, for example, the information provided by the surveys of military conscripts made it possible to exclude improbable results obtained when using particular latency distribution models.
It is important to observe that, after a period of rapid increase during
the 1980s, the incidence curve seems to stabilize at the beginning of the
1990s. That trend may indicate the success of the prevention interventions,
but could also reflect the saturation effect of the population at risk expected
in all epidemic processes [3]. The effect could also be due to the fact that
the national epidemic is a combination of several local epidemics, in which
case the national estimate of the incidence curve
would simply represent the sum of the local estimates. As a matter of fact,
from further
analyses reported below (figures XX-XXII), it appears that the application
of the method at the regional level provides a picture of several sub-epidemics
with peaks located at different times and with clear space-time trends. Figure
XX shows the onset incidence estimates for six of the largest regions in
Italy. As can be seen, the principal peak of each curve varies considerably.
In particular, the northern regions
(Lombardy and Emilia Romagna) peaked before the others, more or less simulta
neously the peak of Apulia can be observed (this region can be considered
a border region with respect to the Balkan trafficking route), then the peaks
of the central and central-southern regions (Latium and Campania) occur and,
finally, the peak in Sicily, where, owing to the wider uncertainties corresponding
to recent years, it is also possible that the curve is still increasing.
Statistics on deaths from drug abuse confirm this last observation for Sicily.
Figure XXI gives forecasts of therapy incidence in the
same regions, which can be used to estimate health-care needs in the short
and me dium
term. The observed therapy incidence data correspond well to the curves shown
in the graph (not shown in the present paper). Figure XXII reports the estimated
cumulative incidences, which measure the overall impact of the epidemic since
the beginning in each region. Further analyses for Italy are reported elsewhere
[19].
Figure XX. Incidence of drug users in six regions in Italy, estimated by Gamma latency period distribution, with age at first treatment as a covariate, total population, 1975-1998 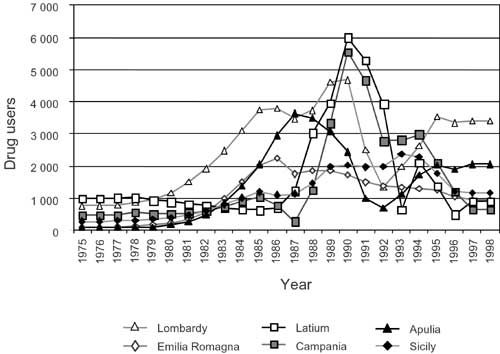 |
Figure XXI. Incidence of drug users in treatment in six regions in Italy, estimated by the Gamma latency period distribution, with age at first treatment as a covariate, total population, 1988-2006 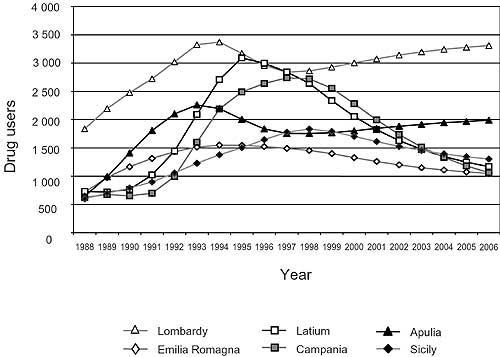 |
Figure XXII. Cumulative incidence of drug users in six regions in Italy, estimated by Gamma latency period distribution, with age at first treatment as a covariate, total population, 1975-1998 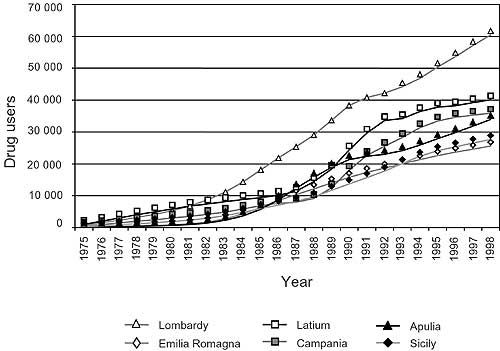 |
The authors' findings show that, in the northern and border regions, where the heroin epidemic is older, the most cost-effective interventions that should be planned are related to health care and rehabilitation, whereas in the regions where the epidemic started later, in Sicily, for example, prevention efforts can also still have a large impact. Further comments on policy implications are reported elsewhere [19]. The Empirical Bayesian Back Calculation method has recently been applied to therapy incidence data from Amsterdam and quite interesting results and comparisons have been obtained [13].
|